TL;DR
- Pipeline hygiene and probability weighting drive forecast accuracy.
- Define and enforce rules for deal age, next steps, and close date confidence.
- Mutual action plans and alerts help catch drift before it hurts the forecast.
- Adopt a weekly forecast cadence that brings clarity to sales leaders and RevOps.
In sales organizations, forecasts steer planning, headcount, and leadership decisions. This article lays out a step-by-step forecast framework that blends pipeline hygiene, weighted probability logic, and activity-based leading indicators to produce a forecast you can trust. The approach combines data discipline with timely signals so teams can act before deals slip.
What is How to Build a Forecast That Doesn’t Lie?
How to Build a Forecast That Doesn’t Lie is a practical approach to forecasting that blends discipline with action. It pairs clear rules for deal health with a calibrated probability model and a set of activity signals that predict momentum. The result is a forecast you can explain, defend, and adjust in real time.
Core components of the forecast framework
Pipeline hygiene: rules for deal age, next steps, close date confidence
Pipeline hygiene rests on three guardrails. First, deal age rules identify aging opportunities that should be re-qualifed or closed. Second, next steps rules ensure each deal has a concrete action and a responsible owner. Third, close date confidence rules require teams to assign a confidence level to the forecasted close date. These guardrails prevent stale data from skewing the forecast and create a living view of momentum.
Practical tip: codify age thresholds (e.g., >60 days in current stage triggers a review) and require updated next steps with dates every two weeks. Link these rules to your CRM workflow so users see prompts when a field is out of spec. For an example of a hygiene checklist, see our pipeline hygiene checklist.
Weighted probability logic
Rather than a single close probability by stage, use weighted probability logic that accounts for deal age, buyer engagement, and historical win rates. Assign base probabilities by stage, then adjust with context signals: recent engagement, decision-maker changes, budget authority, and competitive pressure. The result is a calibrated forecast that responds to real-time signals rather than rigid stage gates.
To implement this, create a simple rule: if a deal has high engagement in the last two weeks, boost its probability; if the decision timeline slips, decrease it. Keep the model transparent so reps understand the math behind the numbers and RevOps can audit results. This approach improves forecast accuracy and reduces gaps between forecasted and actual outcomes.
Activity-based leading indicators
Leading indicators track activity that historically predicts wins or losses. Examples include number of executive touches, number of next-step tasks completed, and timeliness of follow-ups. These signals help you anticipate movement before revenue is booked. Tie activities to forecast value so a surge in specific tasks translates into a higher forecast confidence.
Monitor activities at both the rep level and the team level. If activity drops, trigger alerts or an action plan to re-accelerate deals. For context, see how activity-based indicators align with RevOps playbooks in our resources library.
Building the framework step by step
Follow these steps to construct a forecast that reflects reality, not wishful thinking.
- Map your stages and define rules. Align deal stages with observable signals. Set age thresholds (e.g., 45 and 90 days in stage), specify required next steps, and define the minimum close date confidence for each stage.
- Attach probabilities and thresholds. Start with standard stage-based probabilities, then adjust for age and engagement. Document the rules so anyone can reproduce the results.
- Implement mutual action plans. Each deal should have a mutual action plan that includes owners, due dates, and cross-functional tasks. These plans create accountability and a traceable path to the forecasted close.
- Set cadence and ownership. Assign a forecast owner per region or vertical. Establish a weekly sync to review drift, update probabilities, and adjust plans as needed.
- Automate drift alerts. Build alerts for when deals drift beyond defined thresholds. Examples: probability declines by more than 10% in a week, or a key next step is overdue by more than 7 days.
Tip: protect the forecast with an audit trail. Every change should be timestamped with a reason. This makes the forecast auditable and trustworthy for leadership reviews. For a practical reference, explore our SalesOps basics and see how hygiene, rules, and alerts fit into a standard RevOps stack.
Weekly forecast cadence template for sales leaders and RevOps
Consistent cadence keeps the team aligned and reduces surprises. Use this template to run a predictable weekly forecast review.
- Date and time: 60–75 minutes, weekly.
- Participants: Sales leaders, RevOps, finance liaison, regional managers, and one operations analyst.
- Data sources: CRM (deals by stage, age, next steps), marketing automation (engagement), and finance forecasts.
- Key metrics: forecasted revenue, forecast category (commit, best case, pipeline), win rate by stage, average deal age, and drift alerts.
- Agenda:
- Review How to Build a Forecast That Doesn’t Lie framework health: hygiene, probability logic, leading indicators
- Identify drift and root causes
- Adjust mutual action plans and owner assignments
- Set priorities for the coming week
- Decide follow-up actions and owners
- Deliverables: updated forecast, drift alerts, and revised action plans.
Template example: a simple agenda slide with a chart showing drift over the last 4 weeks and a table of deals flagged for action. For a printable version, see our forecast cadence templates.
Practical example: what this looks like in a real team
Imagine a software company with a 60-day sales cycle. A large deal sits in the proposal stage with an aging pipeline risk. The weighted probability for this deal drops from 65% to 45% because the customer delayed an executive decision. The activity-based leading indicators show a missing executive touch and overdue next steps. The mutual action plan calls for a 2-week executive briefing and a technical validation by the product team.
In the weekly review, the team notes the drift, updates the action plan, and re-allocates resources to support the executive briefing. After two weeks, engagement improves, the deal age resets, and the probability rises again. The forecast reflects these changes, and leadership gains confidence that risk is being managed, not ignored.
This scenario illustrates how each component—pipeline hygiene, probability weighting, and leading indicators—works together. It also shows why a weekly cadence matters: drift is caught early, and teams respond with concrete steps rather than excuses.
Common pitfalls and how to avoid them
- Ignore deal age and you’ll carry stale opportunities. Set clear aging thresholds and enforce updates.
- Overcomplicate probability. Start simple, then add signals as you gain trust in the model. Document every rule.
- Skip mutual action plans. Without them, ownership is ambiguous and forecasting becomes a guessing game.
- Use a single data source. Combine CRM data with engagement metrics to get a fuller picture of momentum.
- Wait for perfect data. Aim for timely data you can act on; perfect data is a moving target.
Addressing these pitfalls strengthens credibility. It also makes it easier to scale the framework across regions and product lines. If you want a deeper dive into data hygiene and governance, check our RevOps guides.
Visuals you should consider
Visuals help leadership grasp forecast health at a glance. Consider a drift dashboard that highlights deals with declining probability or overdue mutual actions. A second visualization could show lead indicator trends by week, with color-coded signals for attention.
Suggested visuals:
- Drift dashboard: deals by stage with velocity and probability changes
- Lead indicator chart: weekly counts of exec touches, next-step completions, and overdue tasks
- Mutual action plan heatmap: ownership and due dates across deals
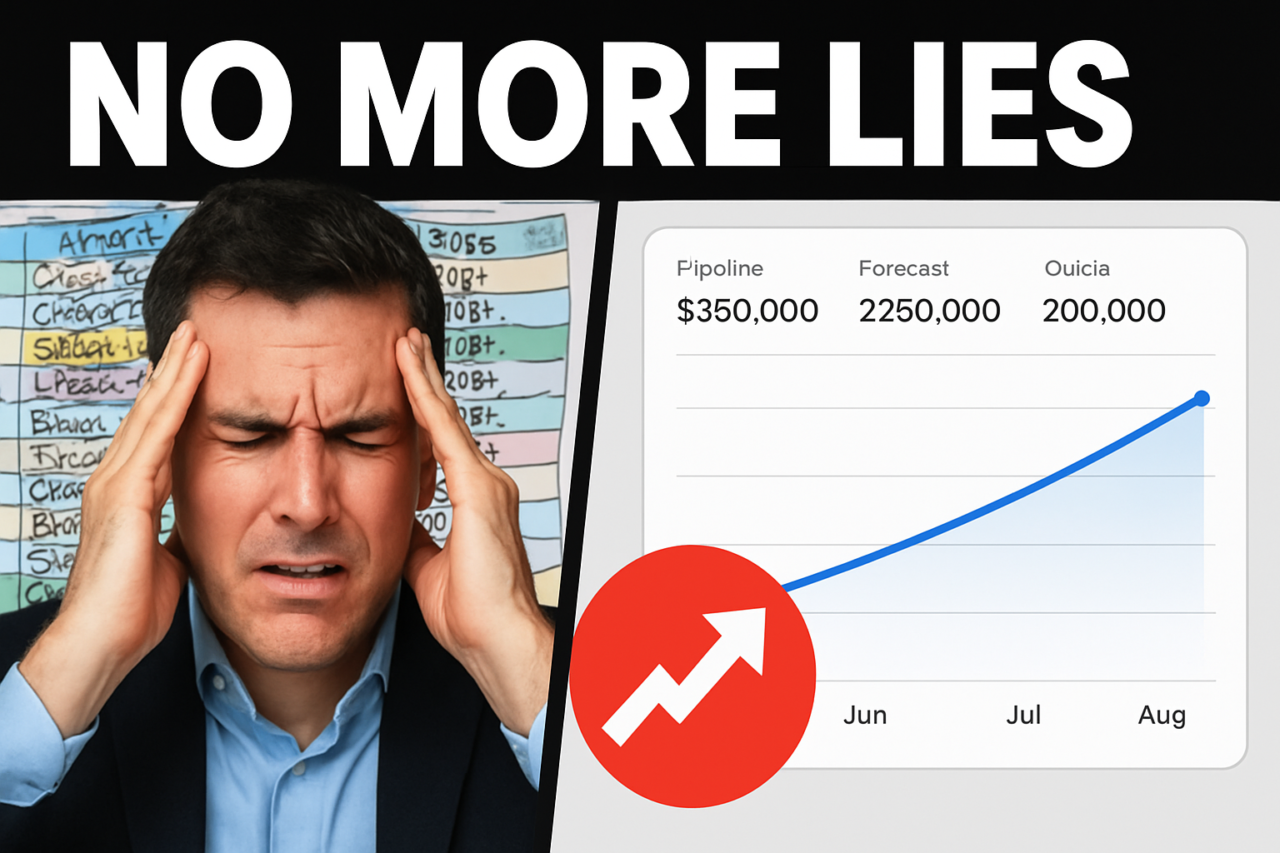
Visuals can be embedded in a weekly dashboard or included in a slide deck for leadership reviews. For a visual reference, consider this placeholder image:  . Its purpose is to summarize drift signals in a single view.
Conclusion
Adopting a disciplined forecast framework reduces guesswork and increases accountability. By combining pipeline hygiene, weighted probability logic, and activity-based leading indicators, you create a forecast that reflects real momentum and not wishful thinking. The weekly cadence then anchors action, ensuring drift is surfaced and addressed promptly.
If you’re ready to apply this approach, start with a one-week pilot in a single region or product line. Map the rules, set the mutual action plans, and automate drift alerts. As you validate the model, scale the framework across the organization. Remember: a forecast that doesn’t lie is a signal to act, not a confession of failure. How to Build a Forecast That Doesn’t Lie can be your blueprint for better planning, faster execution, and smarter investments in growth.