TL;DR
- Lead with leading indicators in every WBR to catch issues before they bubble into revenue risk.
- Time-box the meeting with a disciplined agenda to keep conversations concrete and actionable.
- Link WBRs to quarterly planning so insights drive alignment, priorities, and commitments beyond the week.
- Use a single-page dashboard to surface exceptions and guide decisions quickly.
Operational Cadences That Scale: Weekly Business Reviews for Revenue Teams offer a practical framework for leadership, sales, marketing, and customer success to align on a common picture of performance. The goal is not to audit every metric, but to illuminate the few leading indicators that forecast revenue trajectory and to turn insight into action.
In this guide, you’ll learn how to run WBRs that emphasize leading indicators, identify conversion bottlenecks, and secure action commitments. You’ll find a ready-to-use WBR agenda template, a set of required dashboards, and a clear path to connect weekly reviews with quarterly planning. For teams trying to scale, this cadence is the bridge between weekly execution and longer-term strategy.
Operational Cadences That Scale: Weekly Business Reviews for Revenue Teams in Practice
What makes a WBR powerful is not the volume of data, but the focus. A well-executed WBR answers three questions in every session: Where is the revenue trajectory headed? What bottlenecks are slowing conversions? Which actions will move metrics this week? The phrase Operational Cadences That Scale: Weekly Business Reviews for Revenue Teams captures a discipline that turns data into decisions on a predictable rhythm.
To start, define the leading indicators that matter for your business model. For a typical revenue engine, these include pipeline velocity, lead-to-opportunity conversion, avg deal size, and close-won rate by product line or segment. You will also track time-to-first-value for new customers, renewal health for existing book of business, and churn risk signals. Keep the set lean and aligned with quarterly goals. If a metric isn’t predictive or actionable, retire it from the WBR focus.
Leading indicators vs. lagging metrics
Reserve the slates for leading indicators in the WBR. Lagging metrics like revenue last quarter or last month’s win rate are useful for context, but they don’t drive action in the present. By prioritizing leading indicators, you force the team to engage in problem-solving, not post-mortems. A practical rule: every slide or discussion item should tie to one measurable lead indicator and one concrete action tied to an owner.
The WBR agenda template
Below is a practical, 60-minute agenda you can adopt or adapt. The format emphasizes clarity, speed, and accountability. You can find a printable version in our WBR template page or import it into your collaboration tool for easy reuse. The agenda is organized to keep action commitments front and center.
- 0–5 min: Executive snapshot hot-warm welcome. Quick status update on top 3 leading indicators and any critical alerts.
- 5–15 min: Pipeline health. Review opportunity stage progression and bottlenecks in the funnel. Identify the stage where deals stall and propose a remedy.
- 15–30 min: Lead generation & demand signals. Assess lead-to-opportunity conversion and the quality of inbound versus outbound campaigns. If conversion is dipping, discuss root causes and quick tests.
- 30–40 min: Customer success & retention. Examine renewal risk, time-to-value, and upsell potential with a plan to accelerate value realization.
- 40–50 min: Cross-functional blockers. Capture any internal blockers (pricing, policy, systems) and assign clear owners and deadlines.
- 50–60 min: Actions & commitments. Each owner states one concrete action, the target completion date, and how progress will be tracked. Close with a quick forecast alignment and a reminder of next steps.
Tip: rotate the owner of the WBR and the presenting segments to keep engagement high and reduce cognitive load on any one person. A fresh voice helps surface issues that might otherwise be missed.
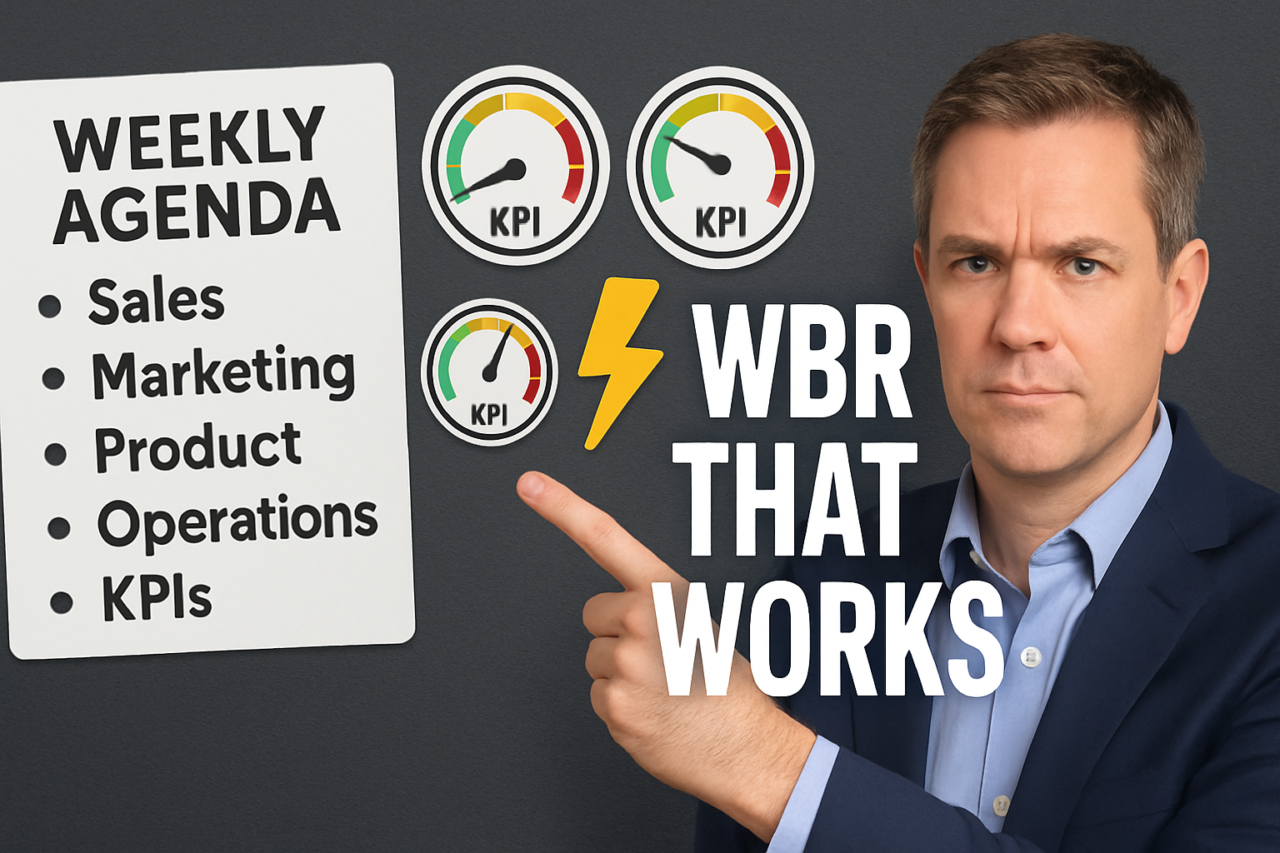
Required dashboards for a successful WBR
Having the right dashboards is essential. A well-constructed WBR dashboard should be a single-page view that enables rapid decision-making. At minimum, include the following panels:
- Lead & opportunity indicators – lead volume, MQL-to-SQL ratios, pipeline creation rate.
- Funnel health – stage-to-stage conversion, average cycle time, time in stage by rep or segment.
- Conversion bottlenecks – stages with the highest drop-off, age of opportunities, win-rate by segment.
- Deal velocity – average days to close, velocity by product line, deal size distribution.
- Revenue forecast vs. plan – current forecast, plan gap, and confidence by region or segment.
For a ready-made reference, see our dashboard templates and adapt them to your data sources. Use color-coding to flag exceptions and ensure that the most critical items stand out at a glance.
Connecting WBRs to quarterly planning
The weekly cadence should feed the quarterly plan, not exist in isolation. Tie WBR outcomes to quarterly priorities by mapping action commitments to quarterly objectives. Create a bridge document that links weekly actions to quarterly milestones, owners, and due dates. This bridge should be reviewed in the final WBR of each quarter to set the stage for the next planning cycle.
Practical example: if the quarterly objective is to increase close rate in the SMB segment, the WBRs should track the SMB funnel health, surface bottlenecks, and approve weekly experiments to improve conversion. Each experiment should have a clear owner, a short time horizon, and a measurable impact. See our quarterly planning bridge for details.
Visual aids and a simple example
Use visuals to simplify complexity. A recommended visual is a one-page dashboard with four panels: leading indicators, funnel health, bottlenecks, and weekly action commitments. This layout helps the team stay aligned and makes it easy for executives to approve course corrections in real time. Consider a companion infographic that shows the top 3 bottlenecks and the top 3 actions for the week.

If you need a quick grounding, review a real-world WBR example from a similar company or industry. You can adapt the structure to your data sources and tech stack. For practical templates, visit our WBR template and customize it for your team.
Pitfalls to avoid and how to fix them
Common WBR pitfalls include overloading the meeting with data, drifting into reporting rather than decision-making, and failing to assign ownership for action items. To avoid these, enforce a strict time box, require one action per owner, and use a simple RACI approach for accountability. If you notice a drift toward vanity metrics, pause the discussion and re-center on leading indicators with demonstrable impact.
Practical example: a one-week sprint in a WBR
Imagine a SaaS revenue team focusing on SMB segments. The WBR highlights a dip in lead-to-opportunity conversion in the SMB funnel. The bottleneck is identified as length of the discovery call. The team agrees on a one-week sprint: shorten discovery calls by 10% through a revised script and pre-call prep checklist, test two call scripts with a small subset of reps, and measure impact on conversion by Friday. The owners are assigned, the metrics are pre-defined, and progress is reviewed in the next WBR. This pragmatic loop keeps the team moving and demonstrates the value of the cadence in real time.
Why this cadence scales when teams grow
As teams scale, a robust WBR becomes more valuable, not more burdensome. The cadence creates alignment across product, marketing, and sales. It helps new hires ramp faster by giving them a predictable framework, reduces the need for endless status updates, and creates a culture of accountability through explicit ownership and deadlines. Importantly, it scales not by collecting more data but by focusing on the right data and rapid, executable decisions.
Putting it into practice
Start with a two-step pilot. In the first week, run a 60-minute WBR with a lean data set focused on one segment and a clear improvement objective. In the second week, add a second segment and refine the agenda based on feedback. After a month, expand to multiple regions or product lines, maintaining the lean data discipline. The core structure—leading indicators, bottlenecks, and action commitments—stays constant even as the data grows.
Visibility and collaboration tools
Make WBRs accessible to stakeholders who are not in the room. Publish the WBR deck and a brief executive summary in a shared space, and keep a running log of all action commitments with owners and due dates. Use collaboration tools to track progress and automatically surface overdue items for the next meeting. This approach keeps momentum even when teams work across time zones or schedules.
Closing thought: a disciplined path to scalable leadership
Operational Cadences That Scale: Weekly Business Reviews for Revenue Teams offer a practical, repeatable path to disciplined execution. By centering conversations on leading indicators, identifying bottlenecks, and locking in action commitments, revenue teams can sustain growth while keeping the organization aligned. The cadence is not a quarterly plan in disguise; it is the weekly discipline that unlocks quarterly progress.
If you’re ready to start, schedule a short trial WBR with your core revenue team and use the agenda template and dashboards described here. You will quickly see how a consistent cadence translates to faster decision-making, clearer accountability, and a more predictable revenue trajectory.
Next steps
1) Choose your leading indicators and set a single-page dashboard. 2) Adopt the 60-minute WBR agenda and assign owners for each action. 3) Connect your WBR to quarterly planning with a bridging document. 4) Try the two-week pilot, then expand. 5) Review and refine the cadence every quarter to keep it relevant.