TL;DR
- Adoption-Led Retention ties retention to concrete product usage milestones, not just time in service.
- Identify north star features that predict long-term value and use them as a basis for milestones.
- Build a milestone map with clear success signals, owners, and nudges when progress stalls.
- Cohort analysis validates which milestones move the needle and guides iteration.
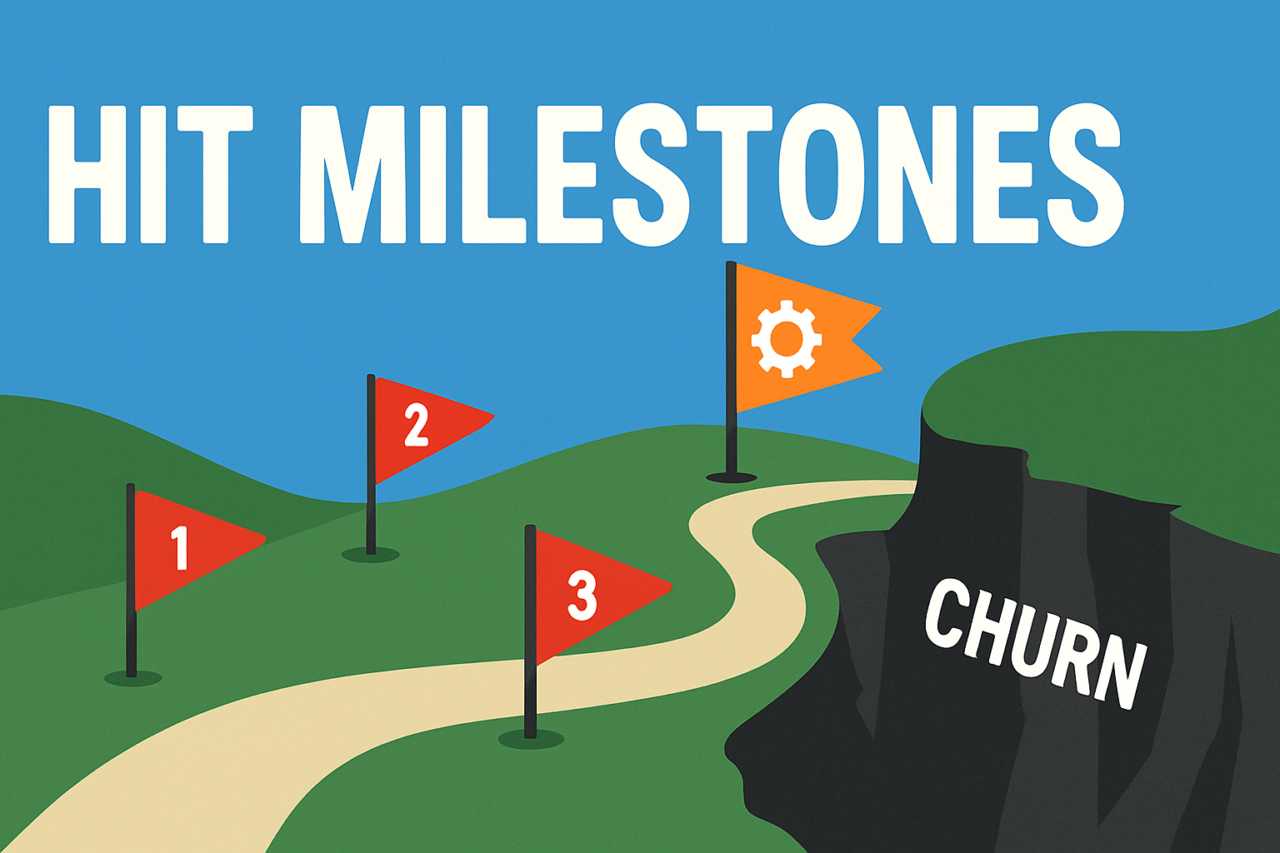
Adoption-Led Retention: The Feature Milestones That Reduce Churn is a practical framework for connecting product value to customer health. By focusing on milestones that reflect real usage and outcomes, you can shorten time-to-value and sustain engagement over the long term.
Adoption-Led Retention: The Feature Milestones That Reduce Churn
Retention thrives when customers reach measurable adoption milestones that correlate with ongoing success. This approach shifts the focus from merely activating a user to guiding them through a sequence of value-generating steps. It also creates a shared playbook for product, customer success, and sales to drive predictable outcomes. For more on identifying value signals, see our guide on north star features.
What are north star features and why they matter?
North star features are the product capabilities most closely tied to customer outcomes. They represent the minimal set of actions that reliably predict retention. By selecting one or two features as north stars, you align teams around a common goal and make it easier to measure impact. In practice, north star features should be directly linked to value outcomes customers care about, such as time saved, revenue impact, or improved efficiency.
To choose them, evaluate usage data, customer interviews, and renewal signals. Look for features whose adoption correlates with renewal rates, net revenue retention, or expansion opportunities. Once you identify these signals, you can map them into a sequence of milestones that customers naturally progress through as they realize value. For further guidance, examine our north star features resource and related case studies.
How to identify adoption milestones tied to success
Start by mapping the customer journey to concrete product actions. Each milestone should have a defined activation criterion, a measurable impact, and a responsible owner. A typical milestone set might include:
- Onboarding completion with a first successful task in the core workflow.
- First value realization such as a benchmark metric achieved or a report generated.
- Advanced usage like automations enabled or integrations connected.
- Team-wide adoption with multiple users in the account actively using the product.
- Retention signal such as renewal or expansion opportunity tied to ongoing usage.
Document each milestone, the data sources, and the expected impact. Use a cohort-based approach to validate that these milestones forecast healthier accounts rather than noisy outliers.
Building a milestone map
A milestone map is a blueprint that shows the path a customer takes from first use to sustained value. It helps you orchestration sales, onboarding, and customer success activities around a shared set of milestones.
- Define milestones with clear success criteria and owners in product, success, and services.
- Assign measurement points that tie usage data to outcomes (eg, feature activation, task completion, value metrics).
- Create nudges and enablement content triggered by milestone progress or stall.
- Link to outcomes so every milestone maps to a business value (retention, expansion, advocacy).
Use the milestone map as your living playbook. It should be visible to the CS, product, and marketing teams and updated when data shows a shift in customer behavior. If you want a practical template, start with a three-tier model: onboarding milestones, value-delivery milestones, and expansion milestones.
Tracking adoption milestones in product and success ops
To avoid data gaps, align analytics with the milestone map and assign data owners. Track the following at minimum:
- Usage events tied to each milestone (logs, features used, time-to-completion).
- Outcome signals like first value achieved, time-to-value, and net usage growth.
- Health metrics including engagement depth, session frequency, and feature coverage.
- Outcome metrics such as renewal probability, expansion rate, and customer satisfaction scores.
Automate nudges when progress stalls. For example, project a checklist email after a week of inactivity in core features, or trigger a guided tour when usage dips below a threshold. Integrate with your knowledge base and enablement resources so customers can quickly move forward.
Internal alignment is crucial. Use dashboards that show progression across milestones by cohort and by account tier. For more on dashboard design, see our adoption metrics dashboard best practices.
Nudges and enablement when customers stall
Stalls are common. A proactive approach minimizes churn risk by delivering targeted support at the moment of need. Consider these tactics:
- Contextual nudges that remind users how a feature solves their current problem.
- Guided enablement such as short videos or in-app tours focused on the next milestone.
- Account-level coaching from a CSM for high-risk customers or enterprise accounts.
- Usage-based incentives like trial extensions or hands-on workshops when progress stalls.
Document which nudges work by measuring time-to-resolve stall, changed activation rates, and eventual renewal outcomes. This enables continuous refinement of your playbook.
Cohort validation: using cohorts to validate milestone impact
Cohorts help you isolate the effect of milestone-driven interventions. Split customers by when they reached a milestone or by the presence of a specific nudge, then compare outcomes such as renewal rates and expansion velocity. Key steps:
- Define cohorts based on milestone attainment timelines and exposure to nudges.
- Measure outcomes over a consistent horizon (eg, 12 months post-milestone).
- Control for confounders like account size, industry, and plan tier to ensure fair comparisons.
- Iterate on milestone definition and nudges based on results.
Cohort analysis is a powerful tool for validating that your adoption milestones genuinely reduce churn and drive growth. For deeper methods, consult our cohort analysis guide.
Practical example: onboarding to value in a mid-market SaaS product
Company A offers a project-management platform for mid-market teams. They define three north star features: (1) core project boards with automations, (2) real-time reporting dashboards, and (3) multi-user collaboration integrations. Their milestone map includes onboarding completion, first automation, first report created, and team-wide adoption. When users stall after onboarding, the CS team triggers a 15-minute in-app walkthrough and a tailored webinar. Over two quarters, renewal probability grew from 68% to 82%, and expansion requests rose 22% among teams that hit the team-wide adoption milestone. This demonstrates the power of adoption-led milestones to reduce churn and drive expansion.
Visualizing milestones: what to chart
Visuals help teams stay aligned and communicate impact to executives. Suggested visuals:
- Milestone progress map across cohorts showing % of accounts hitting each milestone over time.
- Impact heat map linking milestones to renewal and expansion probabilities.
- Time-to-value timeline illustrating the average days from onboarding to first value realization.
Tip: include a simple infographic that shows the milestone sequence and the expected outcomes at each step. This aids cross-functional alignment and onboarding for new team members.
Implementation checklist
- Pick north star features tied to measurable outcomes.
- Define milestones with activation criteria and owners.
- Set up data pipelines to capture usage, outcomes, and health metrics.
- Design nudges and enablement content for stall points.
- Run cohorts to validate milestone impact and iterate.
Document the process in a living playbook shared across product, CS, and marketing. Regularly review milestone performance and adjust as customer needs evolve.
Common pitfalls to avoid
- Choosing too many milestones that dilute focus. Start with 3–5 core steps.
- Focusing on usage miles without outcomes — ensure each milestone links to leverage and value.
- Treating nudges as one-off tasks — automate where possible and monitor effectiveness.
- Ignoring data quality — ensure accurate event tracking and clean cohorts.
Conclusion: sustaining retention through measured progress
Adoption-Led Retention: The Feature Milestones That Reduce Churn provides a practical path to predictable renewal and growth. By identifying north star features, mapping milestones, and using nudges and enablement at the right moments, you align product value with customer success. Cohort validation ensures your milestones truly move the needle, not just look good in reports. As you implement, keep the plan lean, data-driven, and adaptable to changing customer needs. The payoff is durable: fewer surprises in churn, more consistent expansion, and a stronger, more confident growth trajectory.
Visualize your milestones in a simple chart and start testing with a small pilot cohort. The sooner you map the path to value, the faster customers will stay and grow with you.
Ready to start? Build your milestone map today and link it to your onboarding and enablement strategy. For more practical guidance, explore related resources on activation, adoption analytics, and cohort-based experiments.